

AxelAdlerJr
No content yet
AxelAdlerJr
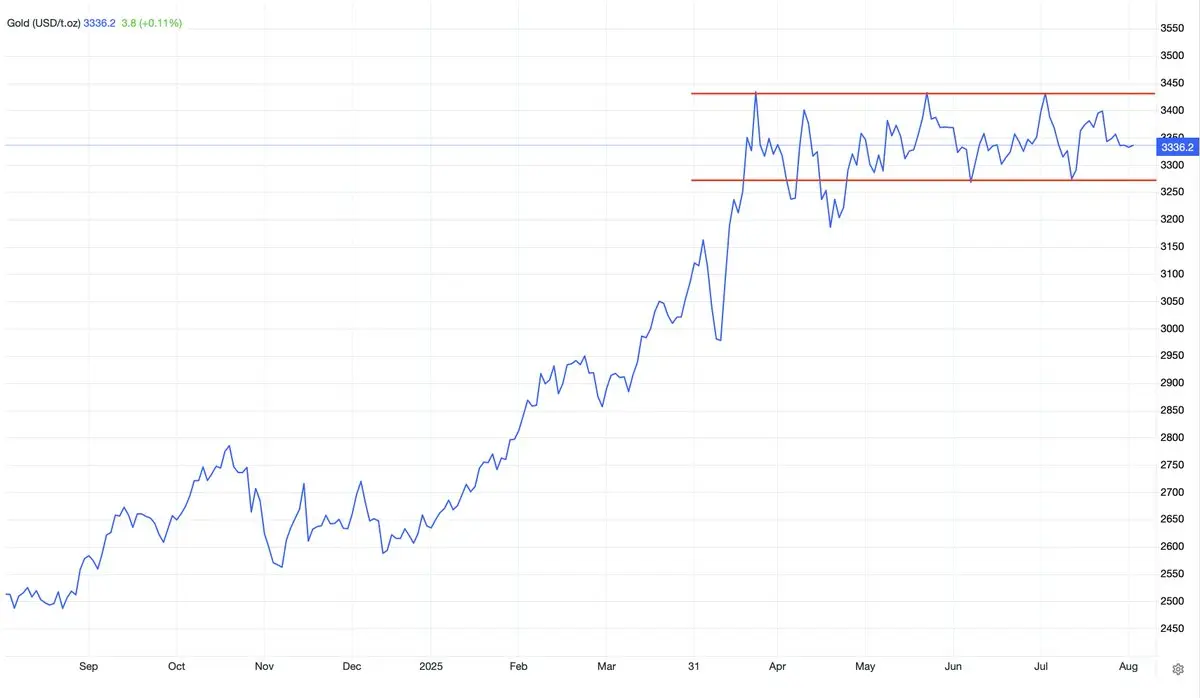
Gold has been trapped in a sideways range since May this is a consequence of frozen drivers. After the vertical rally to ATH, the market had already priced in the Fed's easing cycle and strong central bank demand. From there, the picture hit a plateau: US real yields and the dollar are constrained, inflation expectations are uncertain, and the pace of rate cuts remains unclear. Under these conditions, gold has neither new upward momentum nor reason for a deep decline.
To break out of the sideways range, a shift in one direction is needed - either deeper and more obvious dollar weakness or a de
To break out of the sideways range, a shift in one direction is needed - either deeper and more obvious dollar weakness or a de
- Reward
- like
- Comment
- Repost
- Share
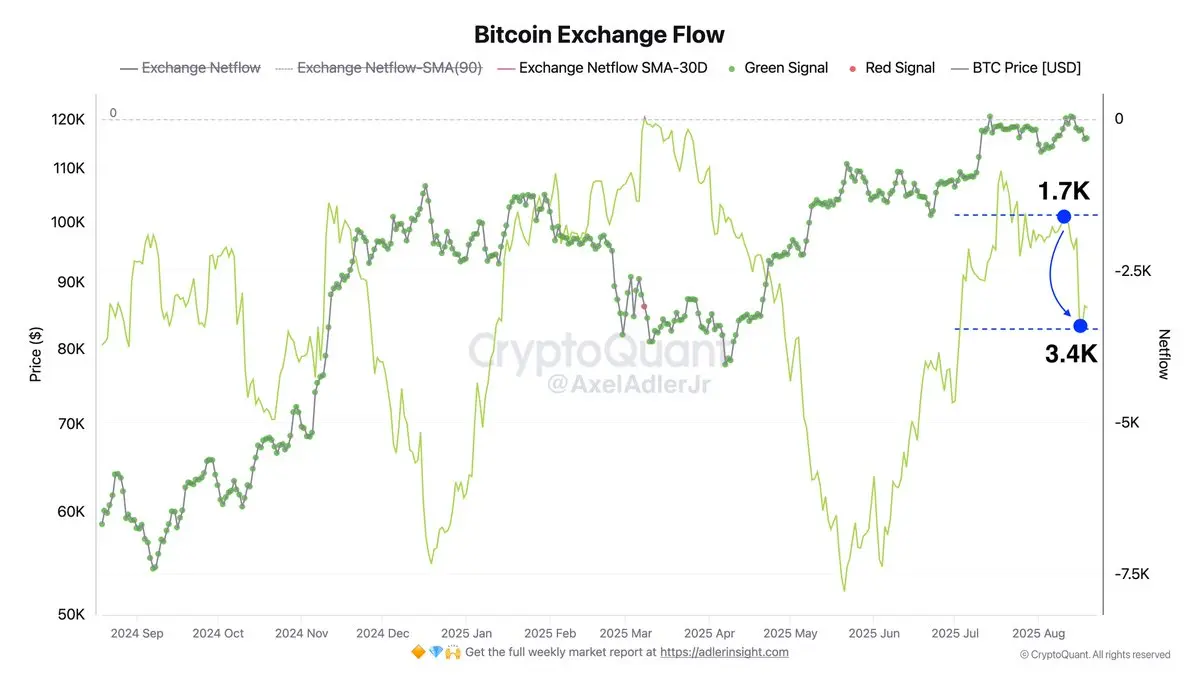
Against the backdrop of price decline, we see strengthening net outflow: the Exchange Netflow-30D moving average became more negative from -1.7K to -3.4K BTC/day. This means coins on CEX exchanges are being bought faster than they are being sold.
Such a shift in a falling market is a bullish divergence, where participants are using the drawdown to buy back coins.
Such a shift in a falling market is a bullish divergence, where participants are using the drawdown to buy back coins.
- Reward
- like
- Comment
- Repost
- Share
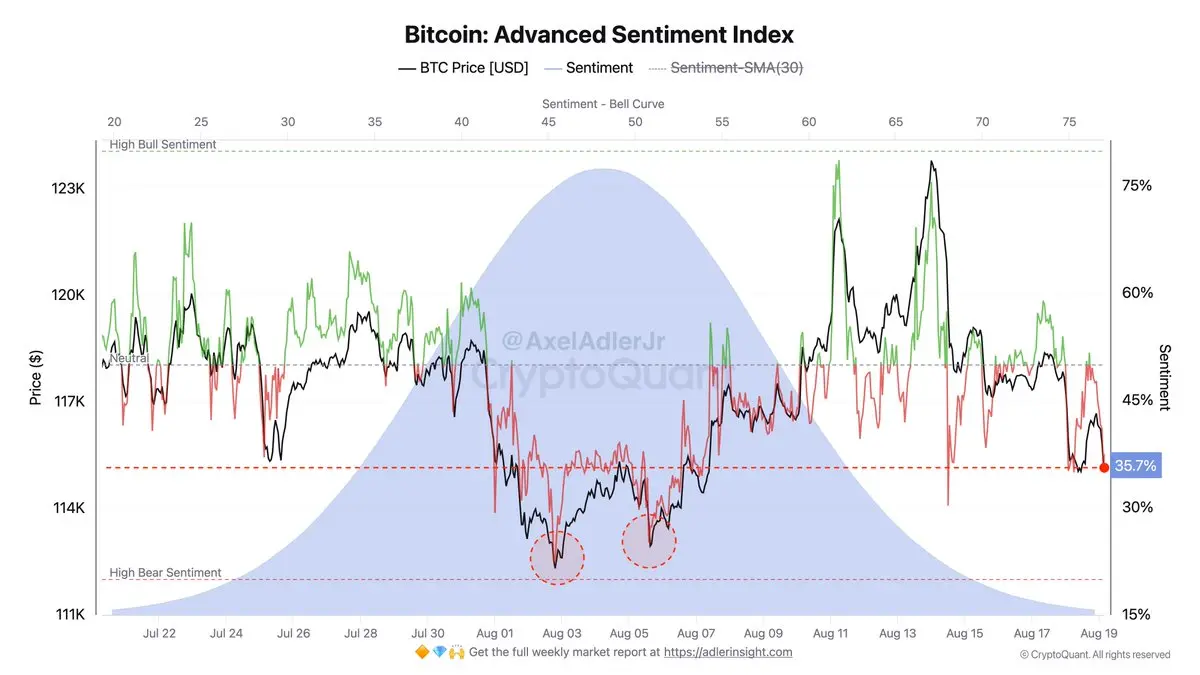
The sentiment index on the futures market has cooled to 36% below the neutral zone. After the spikes on August 11-14, when the metric briefly moved to 70% on price jumps to 123K.
Currently, the price is holding at 115K, while the index momentum is declining: within the index composition, sellers predominate in the short-term moment (negative net-taker and volume-delta) with neutral open interest. This means the market has transitioned from euphoria at the high to a range-trading phase.
Such a profile means that while the index remains below 45-50%, bounces will likely be sold and the price ten
- Reward
- like
- Comment
- Repost
- Share
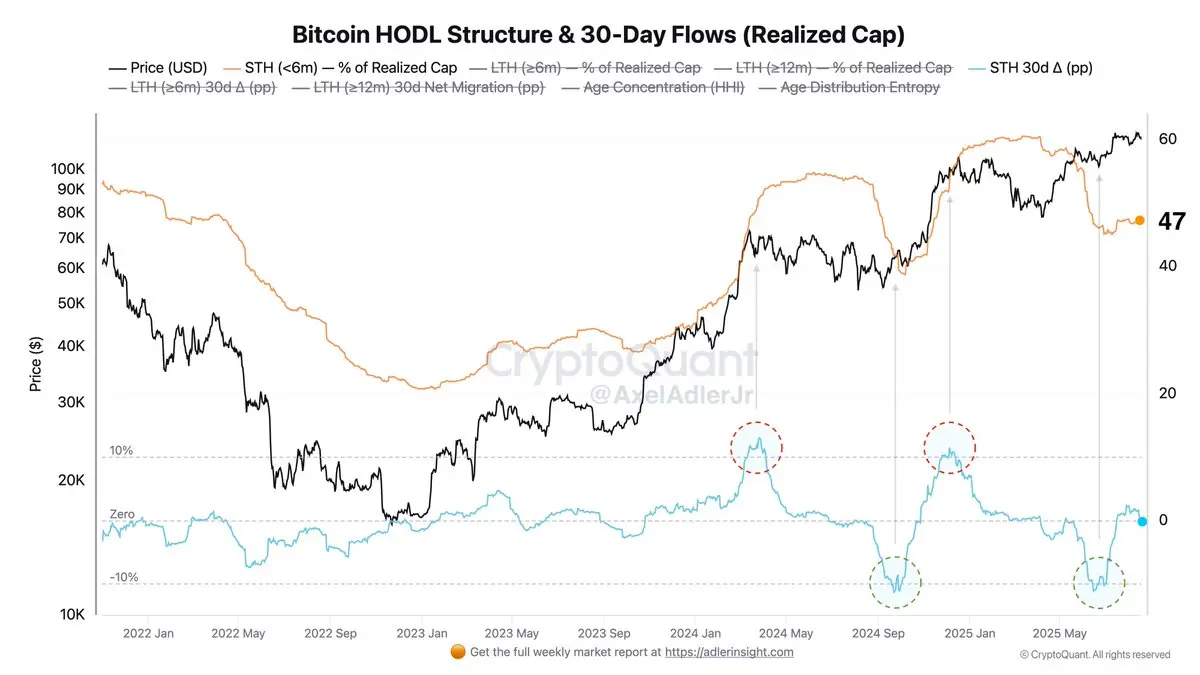
The chart shows the share of STH (<6m) in realized cap (orange line) and its 30-day change STH 30d Δ (blue line).
The blue curve represents the net migration of value toward young coins over the past 30 days. Growth indicates accelerating turnover and distribution from old holders to new ones, while decline indicates coin aging and strengthening of diamond hands.
Currently, the price is at ATH, STH share = 47%, and STH 30d Δ = 0, meaning there has been no notable flow between young and older cohorts over the month.
Spikes in Δ to 10+ percentage points coincided with local overheating and peaks
- Reward
- like
- Comment
- Repost
- Share
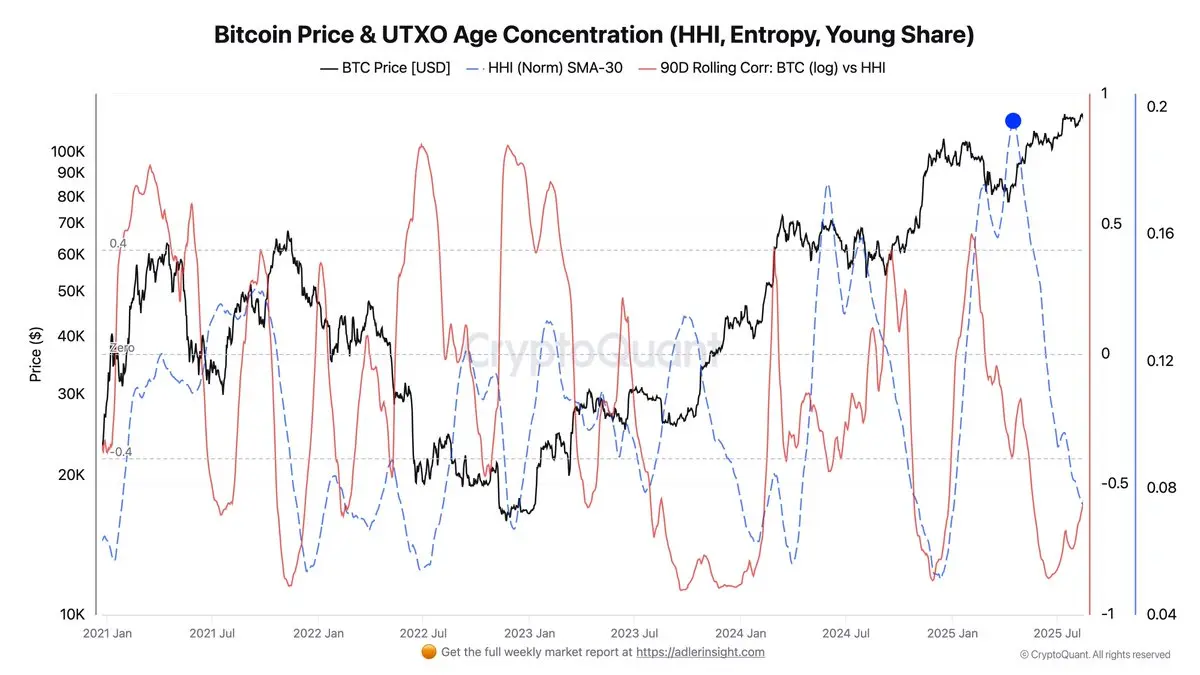
Currently BTC is trading near ATH. The age cohort concentration index (HHI Norm SMA-30) has been declining since April and remains at low levels, while the 90-day correlation of BTC log-price with HHI stays negative (only starting to bounce back after extremely low values).
This combination price growth amid falling concentration - indicates broadening participation across age STH cohorts, which typically makes the trend more sustainable than a narrow rally driven by one or two young buckets.
This combination price growth amid falling concentration - indicates broadening participation across age STH cohorts, which typically makes the trend more sustainable than a narrow rally driven by one or two young buckets.
- Reward
- like
- Comment
- Repost
- Share
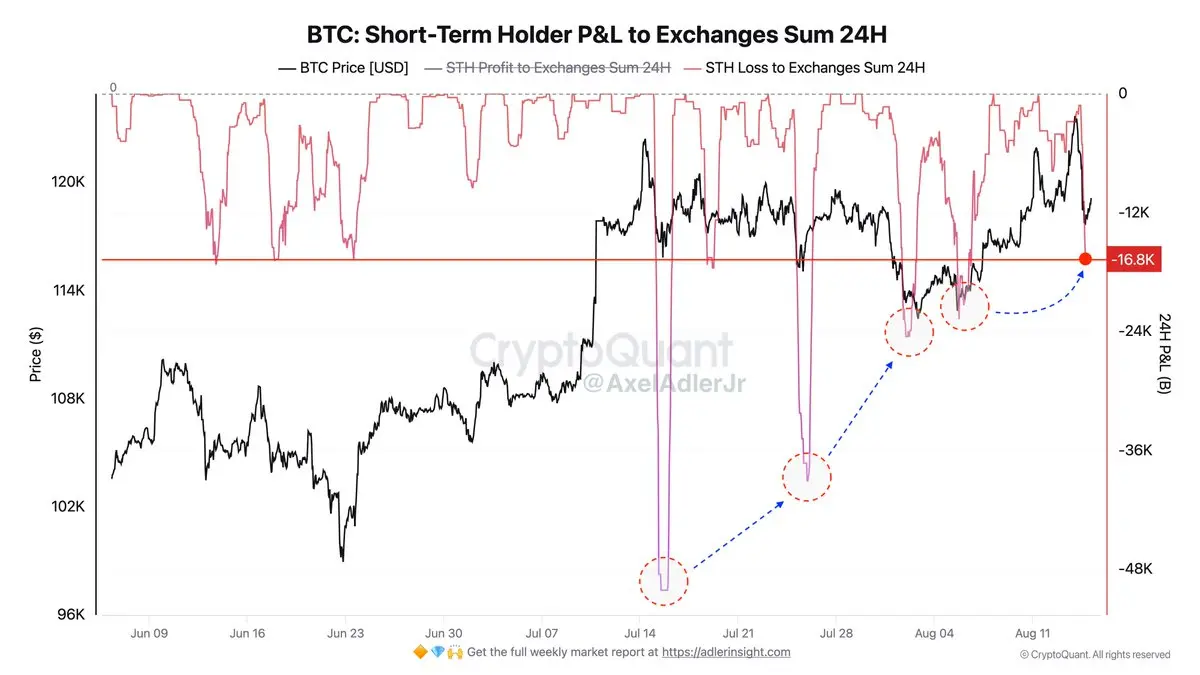
During yesterday's pullback, 16.8K BTC were sent to exchanges at a loss from Short-Term Holders - this is noticeably less than in previous drawdowns. The chart shows a trend of decreasing amplitude of capitulation selling (blue arrows).
This essentially indicates weakening pressure from STH.
This essentially indicates weakening pressure from STH.
- Reward
- like
- Comment
- Repost
- Share
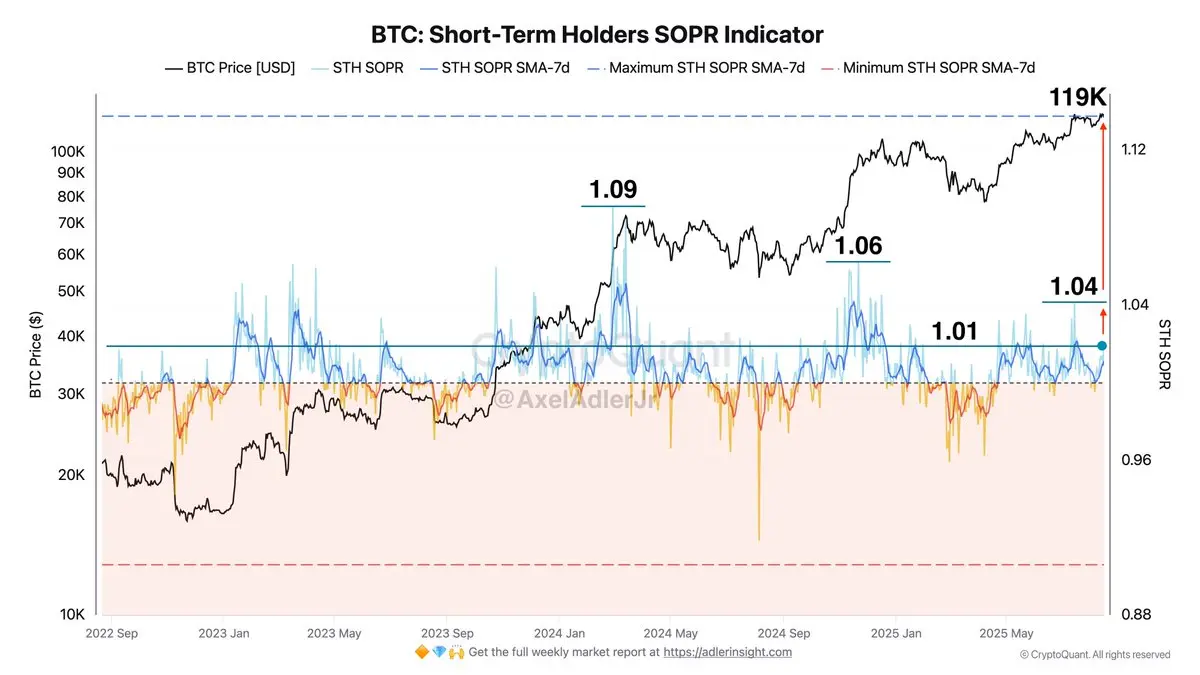
STH SOPR-7d has risen to 1.04 at a price of $119K, meaning short-term holders are on average realizing profits, and the market is absorbing this selling - a bullish sign. The amplitude is still moderate and below the peaks of previous waves 1.06–1.09, so selling pressure from STH is not extreme.
The bullish scenario involves maintaining SOPR-7d > 1.00–1.02 with pullbacks to unity that are quickly bought up.
The indicator moving below 1.0 signals weakening demand and increases the risk of a deeper correction.
The bullish scenario involves maintaining SOPR-7d > 1.00–1.02 with pullbacks to unity that are quickly bought up.
The indicator moving below 1.0 signals weakening demand and increases the risk of a deeper correction.
- Reward
- like
- Comment
- Repost
- Share
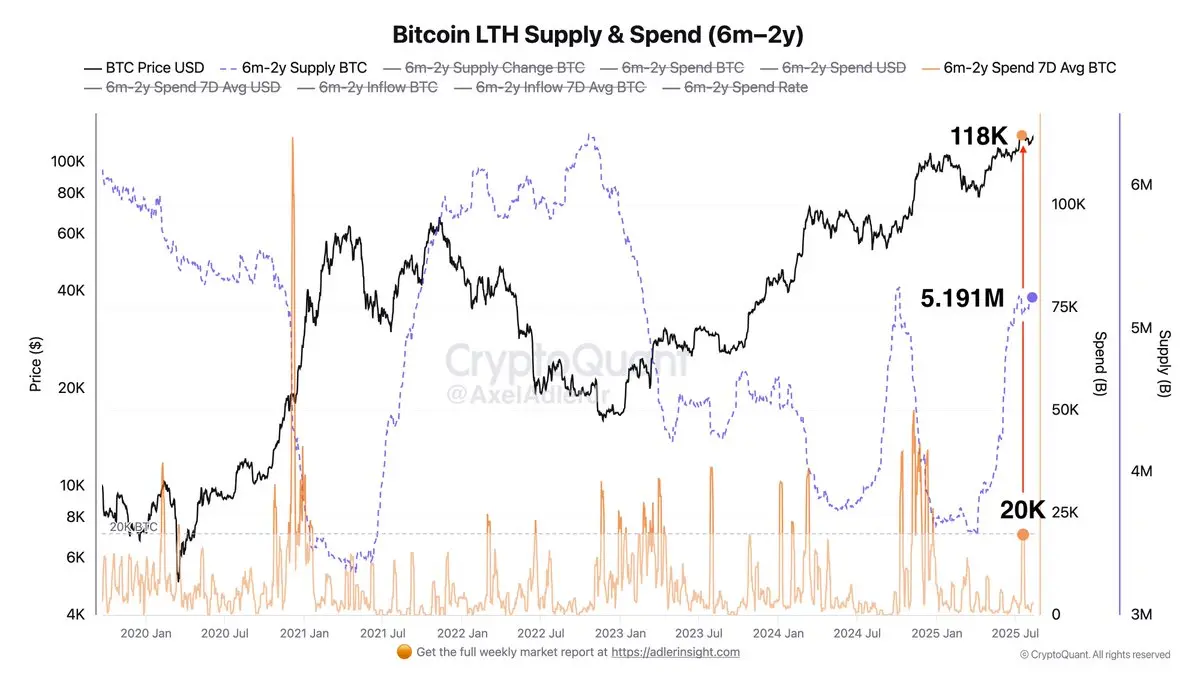
Regarding the accumulation-distribution of the Long-Term Holder cohort holding coins from six months to two years: their supply has risen from 3.551M BTC in April (when the price was $83K) to 5.191M BTC currently (+1.64M BTC). During the ATH test at $118K, there was moderate profit-taking: the cohort's 7-day average spending rose to 20K BTC, which is notably lower than typical spending spikes from the past (40–70K).
In total, this indicates that accumulation is prevailing over distribution among a large number of network participants.
In total, this indicates that accumulation is prevailing over distribution among a large number of network participants.
- Reward
- like
- Comment
- Repost
- Share
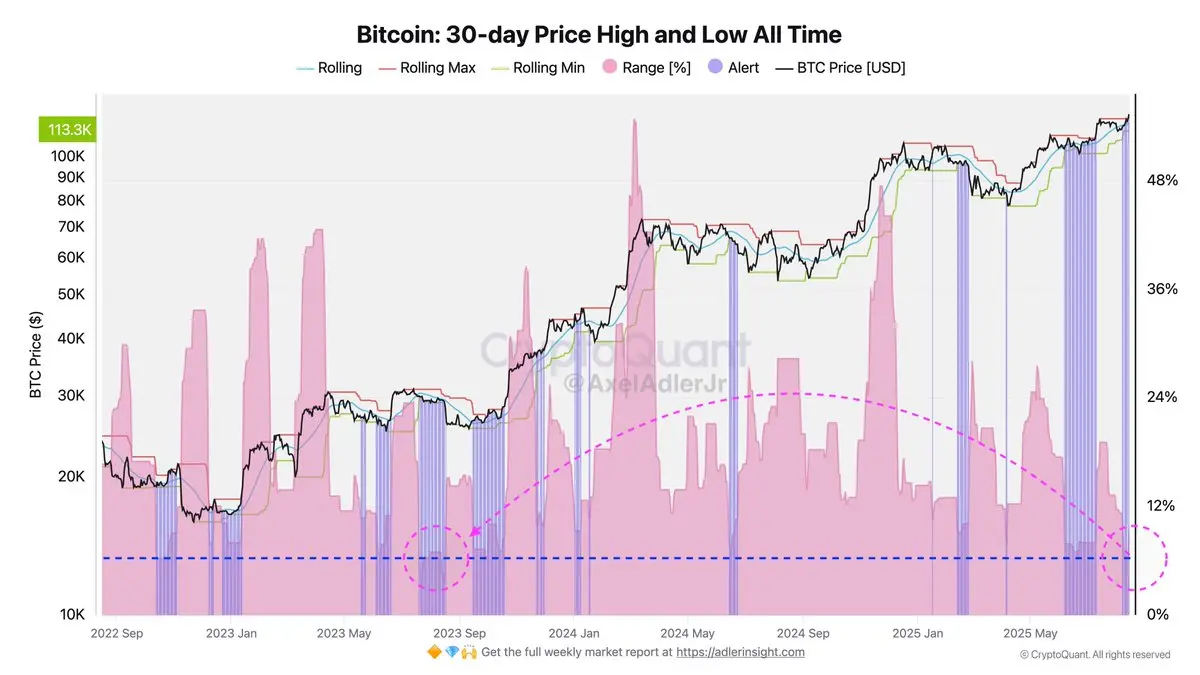
BTC volatility according to the 30-day Price High & Low metric has compressed to a 2-year minimum: the range between the 30-day high and low has narrowed and the bands themselves (rolling max/min) have tightly squeezed the price. Such compression typically reflects supply/demand balance and low realized volatility, when liquidity concentrates above local highs ($120K) and below lows ($113K).
The probability of range expansion is increasing.
The probability of range expansion is increasing.
- Reward
- like
- Comment
- Repost
- Share
- Reward
- 1
- Comment
- Repost
- Share
According to Richmond Fed President Thomas Barkin, the priority between controlling inflation or unemployment, the two functions assigned to the Fed remains unclear at this point.
Meanwhile, Atlanta Fed President Raphael Bostic stated that he considers one interest rate cut in 2025 appropriate, provided the labor market situation remains stable.
Chicago Fed President Austan Goolsbee expects lively regulatory meetings this fall, as the Fed will need to interpret ambiguous economic data.
IN-7.72%

- Reward
- like
- Comment
- Repost
- Share
GM!
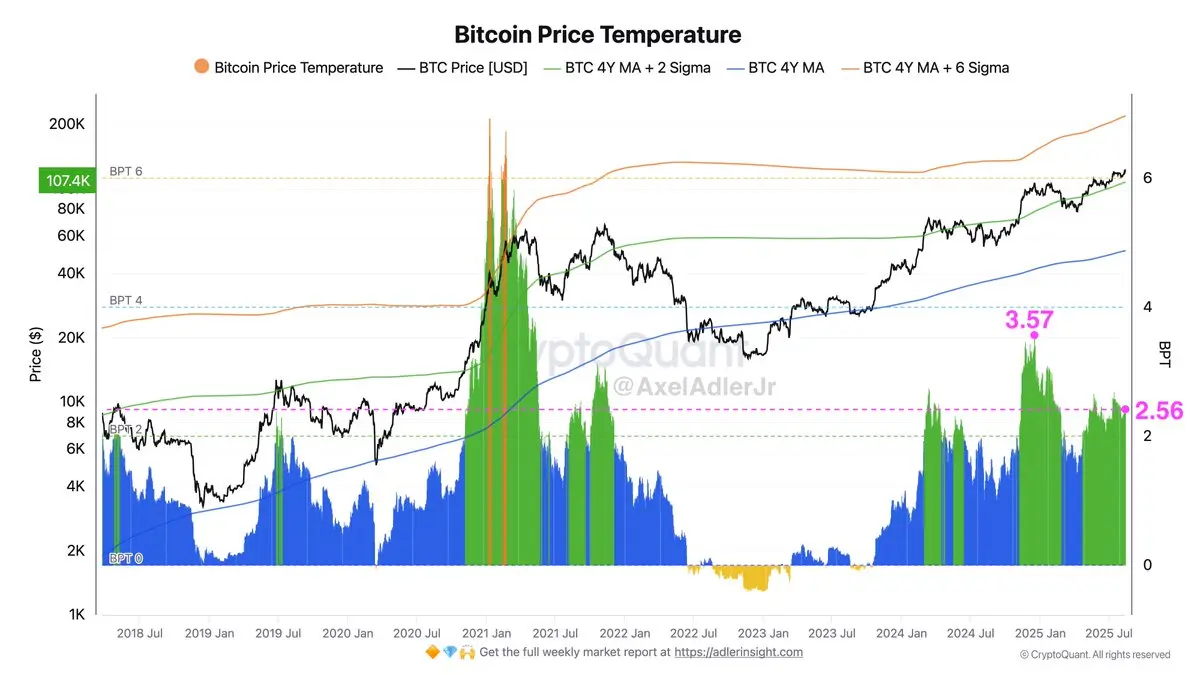
Despite ATH, BPT remains moderately high at 2.56 (below the local peak of 3.57), meaning this is already a "warm" temperature for the current cycle but without obvious overheating yet. Price holds above the 4-year MA and its +2σ (green), confirming the bullish trend.
Main risk is typical corrections within the uptrend, "late-stage" signals will appear when BPT accelerates above 3.0.
- Reward
- like
- Comment
- Repost
- Share
- Reward
- like
- Comment
- Repost
- Share
Annual inflation in the US remained at 2.7% in July, ignoring forecasts of an increase to 2.8% due to tariffs. However, core inflation, excluding food and energy, rose from 2.9% to 3.1% above expectations and at a six-month high.
The rise in core CPI increases the probability of a longer period of high Fed rates, shifting down expectations for the pace of easing, which could put pressure on stocks, cryptocurrencies and other risk assets.
The rise in core CPI increases the probability of a longer period of high Fed rates, shifting down expectations for the pace of easing, which could put pressure on stocks, cryptocurrencies and other risk assets.

- Reward
- like
- Comment
- Repost
- Share
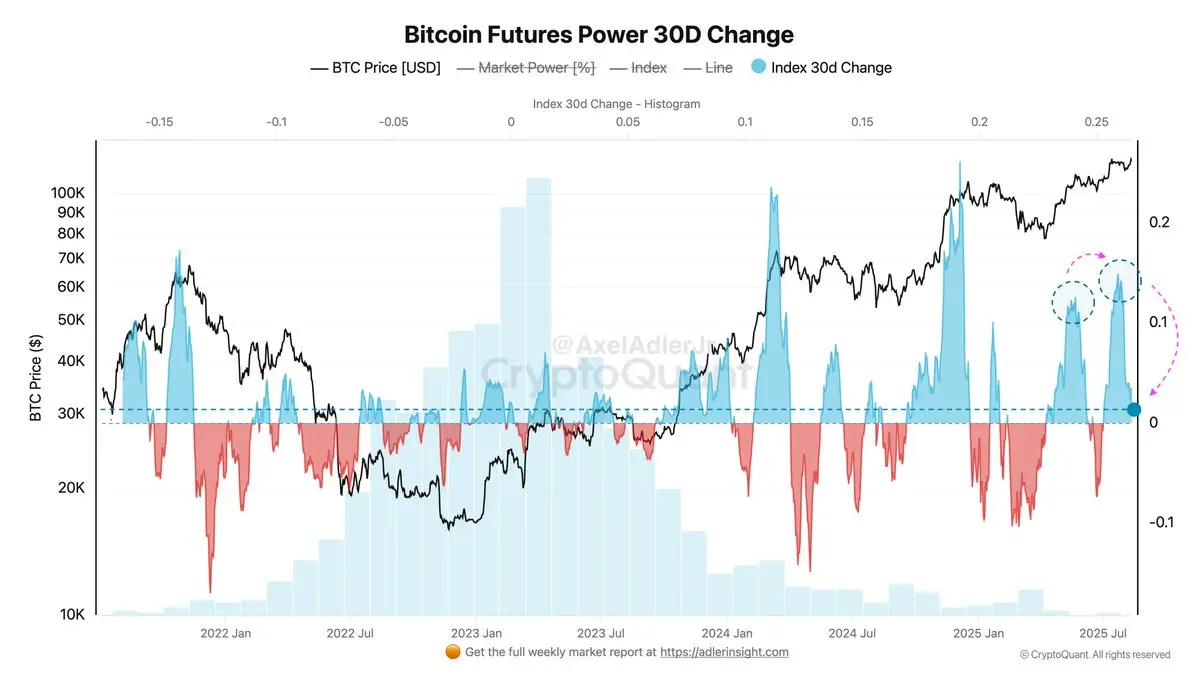
In August, the Bitcoin Futures Power index dropped to the zero mark after a series of positive values that previously accompanied BTC growth. This reflects a slowdown in momentum in the futures market, which takes into account the combined influence of open interest, funding rates, and taker order imbalances.
With the current price near ATH, the neutral index value increases the probability of it transitioning into negative territory, which has historically been accompanied by market corrections.
With the current price near ATH, the neutral index value increases the probability of it transitioning into negative territory, which has historically been accompanied by market corrections.
- Reward
- like
- Comment
- Repost
- Share
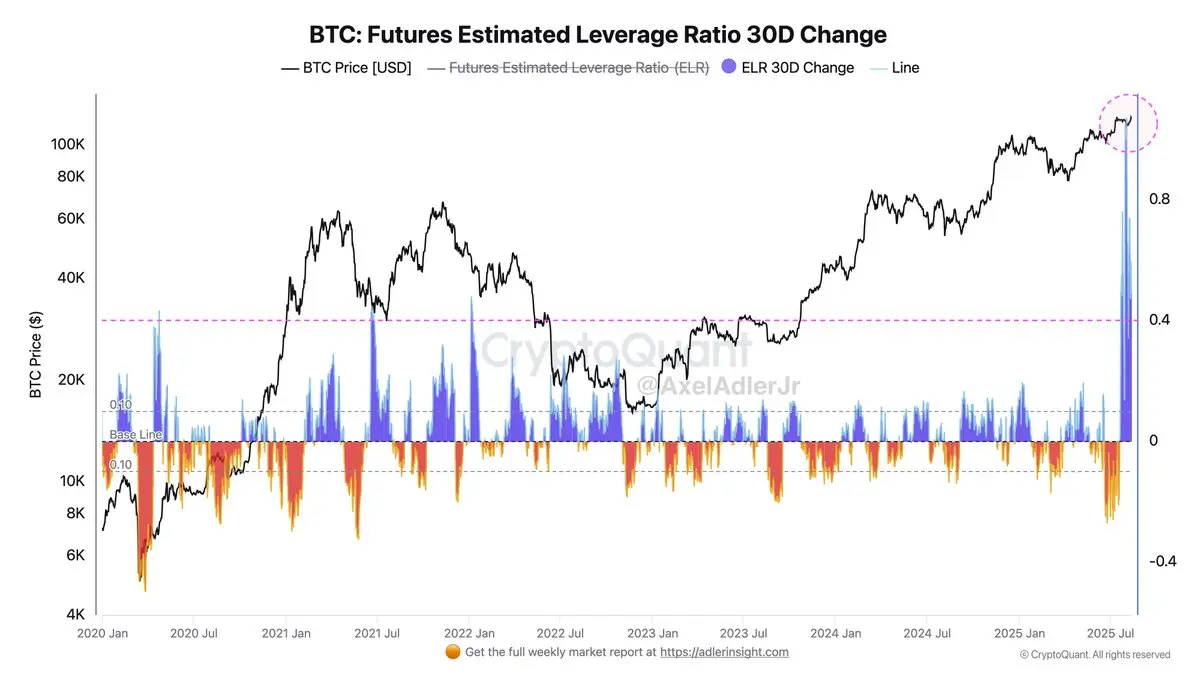
The 30-day change in Bitcoin futures Estimated Leverage Ratio (ELR) in August 2025 reached record levels over five years, exceeding the +0.4 threshold that previously coincided with peak periods of elevated leverage and increased market vulnerability.
Essentially, this indicates a rapid and large-scale influx of leveraged positions in futures while the price remains near historical highs, creating conditions for heightened volatility and the risk of sharp liquidations.
Essentially, this indicates a rapid and large-scale influx of leveraged positions in futures while the price remains near historical highs, creating conditions for heightened volatility and the risk of sharp liquidations.
- Reward
- like
- Comment
- Repost
- Share
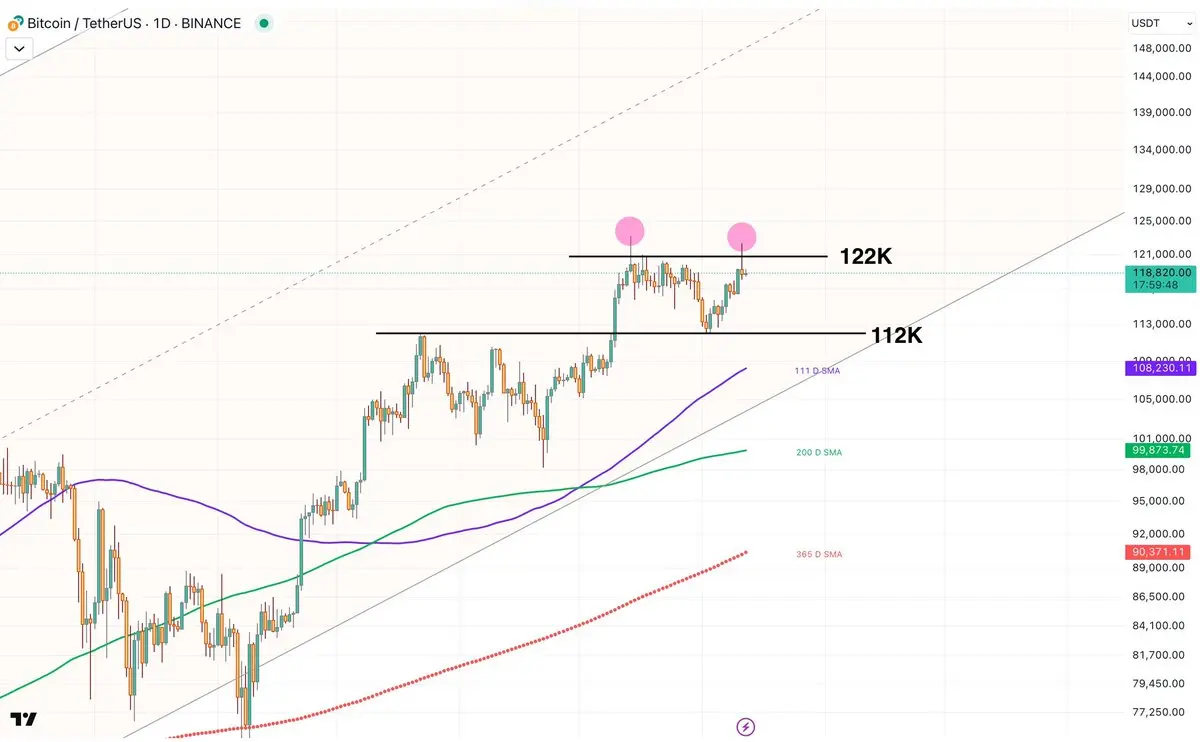
Above ATH, there are a lot of bears starting to short the market - this is visible in the daily candles at the ATH level.
The market wouldn’t mind another correction down to 112K–110K.
The market wouldn’t mind another correction down to 112K–110K.
IN-7.72%
- Reward
- like
- Comment
- Repost
- Share
- Reward
- like
- Comment
- Repost
- Share